This is Part 2 of a 5-part series will highlight each step of our recommended investment plan that will help you build and monitor your own DIY Dividend Portfolio.
The Importance of a Proper Investment Plan
Most "do-it-yourself" investors fail miserably over the long-term. As a matter of fact, the majority of professional investors fail to beat the returns of the broader market indices every year. That said, there is one common trait that every successful investor shares?an investment plan!
Unfortunately, simply setting up an investment plan isn't enough to succeed these days. You also have to have the discipline to carry out that plan (come rain or shine). Contrary to popular belief, the market does not control your investment success?you do!
While the specific details of a dividend investor's personal investment plan will vary based age, risk tolerance, etc., we suggest that investors use the plan below as a guide (links to previous parts of this series are highlighted below in blue):
- Identify, research, and invest in dividend stocks with the best risk/reward profiles.
- Identify low-risk entry points for each stock (i.e., a "Buy Zone").
- Adhere to strict asset allocation targets (for asset classes, industries, and individual stocks).
- Maintain a disciplined exit strategy for each stock by closely monitoring changes fundamental and technical data points.
- Utilize portfolio hedging techniques and conservative option strategies to manage downside risk.
Part 2: Determining A "Buy Zone" For Each Stock
In Part 1 of this series, we discussed our strategy for deciding WHICH dividend stocks to buy for our DIY Dividend Portfolio (utilizing our dividend stock rating system). In this part, we will discuss WHEN to buy a specific dividend stock.
We believe that patience is a virtue. Just because a stock has a high rating in our system, it doesn't necessarily mean that you should run out and purchase it that day. We scan the charts of our top-rated stocks daily looking for strong levels of support and resistance, which ultimately helps us determine a target "Buy Zone" for each stock. We believe that patiently waiting for a low-risk entry point for a given stock will drastically improve your long-term investment results.
In other words, we use fundamentals to decide WHICH stocks to buy and we use a combination of technicals and valuation to determine WHEN to buy those stocks.
If you are a new dividend investor and are building your DIY Dividend Portfolio from scratch, don't feel pressured to have a fully diversified portfolio on day one. Dividend investing is a marathon, not a sprint. It's extremely important to be patient when building a long-term portfolio...we can't stress that enough. As a matter of fact, we have only invested 7% of our $500,000 "model" DIY Dividend Portfolio since launching it a few weeks ago. We remain somewhat cautious as the market continues to grind higher and many of our top-rated stocks are currently well above their respective "Buy Zones". We'll stick to our plan in the coming weeks and patiently wait for our entry points.
What Is A "Buy Zone"?
As we highlighted above, once we have decided that we want to purchase a particular stock, we look for a low-risk entry point to open the position. We call these entry points our "Buy Zones" and they are points at which long-term dividend investors should feel comfortable starting to build a position in the respective stocks. We focus on four key levels of support when determining a "Buy Zone":
- Technical - Support from short and long-term trend lines (i.e, 10-week and 40-week moving average).
- Volatility - Target correction levels based on historical volatility and maximum draw down.
- Valuation - Support levels based on historical valuation multiple.
- Yield - Support levels based on forward dividend yield.
We then average the low end and the high end of these key support levels to determine our target "Buy Zone".
It should be noted that this is how we determine our "Buy Zones", but there are no right or wrong answers here. We encourage investors to think hard about the key levels of support for their own stocks. What is the valuation level that you would feel comfortable buying a certain stock? What yield level makes sense for you? Also, you may want to add different parameters that fit your investment style better. The key takeaway here is that you establish a consistent process for determining a "Buy Zone". Finding low-risk entry points for your stocks will drastically improve your odds of investment success.
"Buy Zone" Examples
Below are some examples of stocks that were recently highlighted in our weekly "Buy Zone" Report (including our key support levels). These stocks are currently either in or very close to their respective "Buy Zones".
(click to enlarge)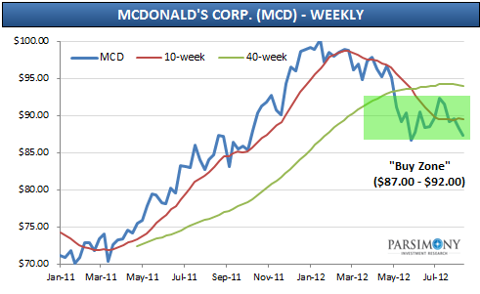
Technical - Support from short and long-term trend lines
- McDonald's Corp. (MCD) is currently trading below its 10-week and 40-week moving averages thanks to the company's recently lowered guidance. That said, we believe the stock's recent low at the end of May ($86.50) will provide a strong level of support.
Volatility - Target correction levels based on historical volatility
- MCD's historical price volatility (1-year) is 15.2%. Our target pullback for MCD (from recent highs) is 12%-15%, which equates to a price range of approx. $87.00-$90.00.
Valuation - Support level based on historical valuation multiples
- MCD has traded in a very tight valuation range over the past 3 years and we think the stock will get meaningful institutional support in the 16.0x-17.0x P/E range (which equates to a price range of approx. $85.00-$90.50).
Dividend Yield - Support level based on forward dividend yield
- From a yield perspective, we think that a yield north of 3.0% is very attractive for MCD and the 3.0%-3.25% yield range should provide some decent price support (which equates to a price range of approx. $86.25-$93.50).
(click to enlarge)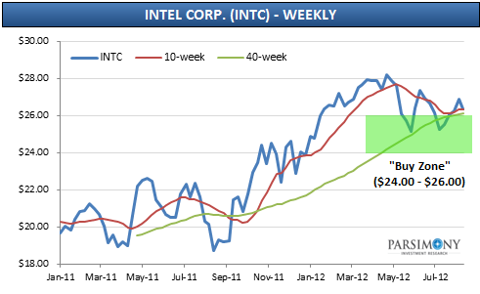
Technical - Support from short and long-term trend lines
- Intel Corp. (INTC) is currently hovering around its 10-week and 40-week moving averages, which are converging around the $26.25 level. We believe INTC will get strong support around this level and investors should watch the stock closely.
Volatility - Target correction levels based on historical volatility
- INTC's historical price volatility (1-year) is 26.2%. Our target pullback for INTC (from recent highs) is 15%-20%, which equates to a price range of approx. $23.50-$25.00.
Valuation - Support level based on historical valuation multiples
- INTC has traded in a wide valuation range over the past 3 years (8.9x - 50.5x) and the stock is currently trading very close to the low end of that range. That said, we believe the stock will get support in the 10.0x-11.0x P/E range (which equates to a price range of approx. $23.50-$26.00).
Dividend Yield - Support level based on forward dividend yield
- From a yield perspective, we think that a yield around 3.5% is very attractive for INTC and the 3.5%-4.0% yield range should provide some decent price support (which equates to a price range of approx. $22.50-$26.00).
(click to enlarge)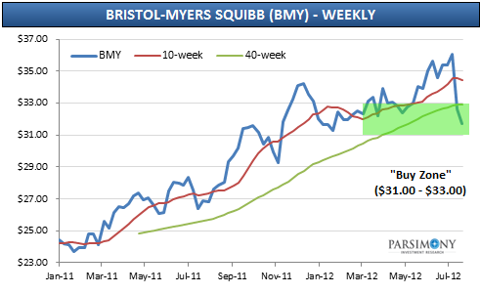
Technical - Support from short and long-term trend lines
- Bristol-Myers Squibb (BMY) traded below its 10-week and 40-week moving averages a few weeks ago after the company announced some disappointing news about its hepatitis C drug INX-189. That said, we believe the stock won't stay below these levels for long.
Volatility - Target correction levels based on historical volatility
- BMY's historical price volatility (1-year) is 20.0%. Our target pullback for BMY (from recent highs) is 10%-15%, which equates to a price range of approx. $31.00-$32.75.
Valuation - Support level based on historical valuation multiples
- BMY has traded in a pretty tight valuation range over the past 3 years, averaging around 15.0x earnings. We think the stock will get meaningful institutional support in the 15.0x-16.0x P/E range (which equates to a price range of approx. $31.25-$33.25).
Dividend Yield - Support level based on forward dividend yield
- From a yield perspective, we think that a yield north of 4.0% is very attractive for BMY and the 4.0%-4.5% yield range should provide some decent price support (which equates to a price range of approx. $30.25-$34.00).
Summary
Patience. Patience. Patience.
We passionately believe that patiently waiting for a low-risk entry point for a given stock will drastically improve your long-term investment results. DIY Dividend Investors can determine target "Buy Zones" for any stock that they are considering by analyzing the stock's key support levels that we discussed above. Use the examples that we provided for MCD, INTC, BMY as a guide.
Remember that dividend investing is a marathon, not a sprint!
Note to readers: We will detail how to establish asset allocation targets in Part 3 of this series, so please make sure to "follow" us.
Disclosure: I am long MCD, BMY, INTC.
menorah chanukah chanukah david archuleta david archuleta hobbit trailer greenhill
No comments:
Post a Comment
Note: Only a member of this blog may post a comment.